


Understanding SUI’s Market Landscape: Analyzing the Altering Dynamics of Sui (SUI)
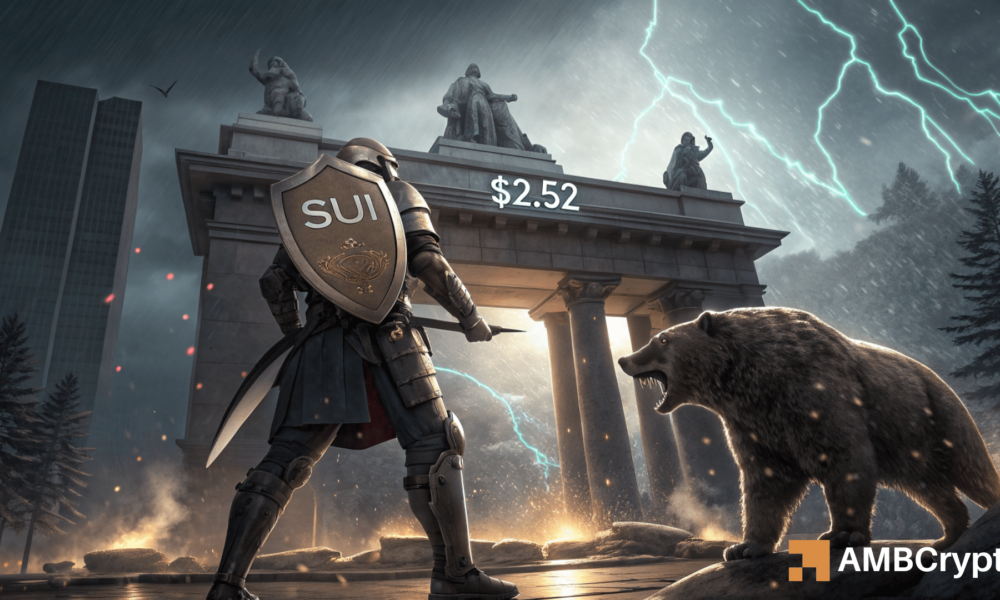
Recent market developments show that Sui (SUI) is currently maneuvering within a challenging phase, illustrated by the formation of a bullish inverse head and shoulders pattern. Typically emerging after prolonged downtrends, this pattern signals a potential reversal that traders keenly monitor for entry points. Recent data indicates that after reaching the $2.20 support zone, SUI made slight recoveries, but the price has faced significant resistance at the $2.52 neckline, crucial in confirming this bullish pattern. With SUI trading at approximately $2.22—reflecting an 8.73% decline over the past day—market sentiments lean towards bearish momentum, suggesting that sellers maintain control for the time being.
To delve deeper, technical indicators portray a mixed narrative. The daily chart shows the MACD indicator beginning to curl upwards, which may infer an upcoming shift in market momentum, even as it remains entrenched in bearish territory. Fibonacci retracement levels indicate strong user interest between $2.16 and $2.22, with SUI testing this crucial support area. Should the price fail to sustain beyond this level, potential bearish pressure could trigger a decline towards the 1.618 Fib extension, marking a critical threshold at approximately $1.42. Thus, breaching the resistance at $2.52 becomes imperative for SUI bulls to gain increased confidence and drive the price higher.
Exploring the recent dynamics of liquidations offers further insight into the underlying market sentiment. The liquidation data from April 3 highlighted a stark imbalance: long liquidations reached $1.92 million, notably eclipsing short liquidations at only $675.78K. This significant discrepancy indicates a surplus of bullish sentiment in the market, suggesting that many traders holding long positions may have been caught off guard, ultimately leading them to exit their trades. The spike in long liquidations is suggestive of a market reset, potentially creating an environment for more robust traders to step back in and capitalize on the recovering market.
Additionally, analyzing the funding rates reveals a cautious outlook among traders. Recently, the OI-Weighted Funding Rate revealed a slight downturn to -0.0056%, suggesting dominance from short positions amidst heightened bearish sentiment. While this indicates that traders are leaning towards bearish positions as the market awaits direction, the overall funding rate hovering near neutrality suggests a period of indecision. A breakout above the critical $2.52 mark could spark renewed interest and shift trader sentiment, potentially leading to a bullish reversal.
From a broader perspective, the current market dynamics suggest that while SUI has the potential for a bullish reversal, the prevailing bearish momentum cannot be overlooked. The persistence of sellers maintaining pressure despite a possible inverse head and shoulders pattern indicates a challenging landscape for bullish scenarios. Consequently, the focus remains on breaking and holding above the $2.52 neckline—this level is pivotal for a substantial trend reversal to take place. Until this critical threshold is breached, the likelihood of further downside movements toward support levels at $2.16 or even $1.42 remains prevalent.
In conclusion, Sui (SUI) resides at a crossroads characterized by potential recovery overdue for momentum-driven confirmation. The existing inverse head and shoulders pattern showcases the underlying bullish potential; however, with sellers firmly in control, skepticism persists amidst the resistance at $2.52. For traders and investors, the essential takeaway is clear: until a definitive move above this resistance occurs, consistent bearish pressure may foster a complex trading environment. Overall, careful monitoring of market trends, liquidations, and funding rates will be vital for anticipating the next significant movement in SUI’s price trajectory.


