


AAVE Price Analysis: Navigating Current Market Trends and Future Projections
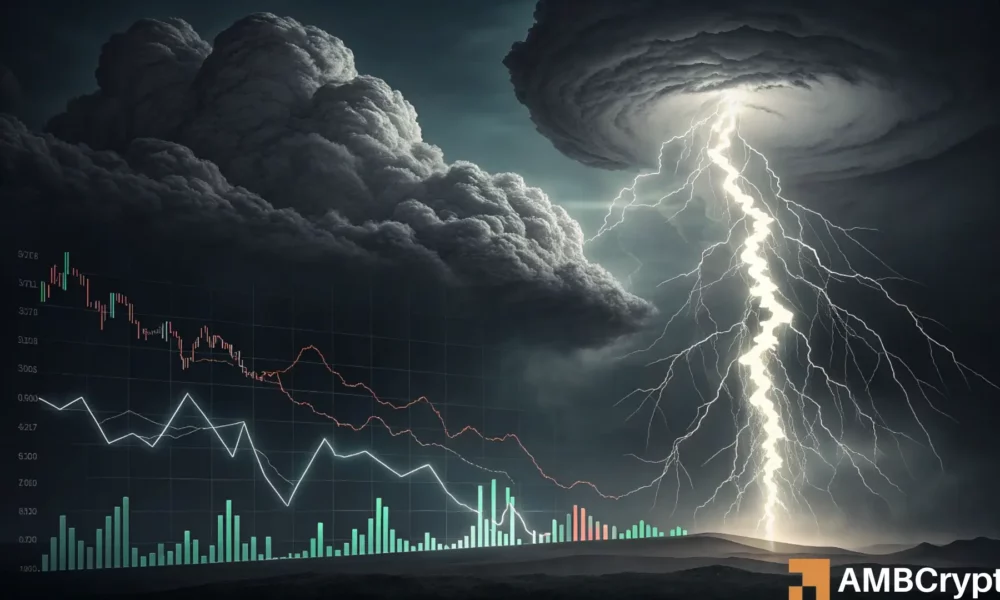
In recent days, AAVE has demonstrated a complex market behavior characterized by fluctuating buying pressure and price action. Notably, indicators suggest a potential slowdown in buying momentum, especially over the past ten days. This decline raises concerns that a fall below the critical $260 threshold could signal a deeper downward trend towards the established range lows. Traders and investors should closely monitor these dynamics to avoid unfavorable positions.
Recent Market Activities and Whale Investments
Adding a layer of intrigue to AAVE’s market situation, a prominent whale purchased approximately $15 million worth of the altcoin after its price dipped to the $239 level. This significant buy-in was interpreted as a strategic move, resulting in a 10% rally shortly after the dip. However, as of the latest updates, the price has retraced once again, indicating the volatility typically associated with cryptocurrency markets. While this buying activity initially appeared to bolster the price, the overall trend remains uncertain.
Analyzing the Bullish Trend and Market Structures
Since May 8, AAVE has maintained a generally bullish market structure. The upward trajectory is evident, characterized by higher highs and higher lows. However, over the preceding two weeks, the price has stagnated, establishing equal highs and lows, forming a short-term range that merits further analysis. Indicators such as the Accumulation/Distribution (A/D) demonstrate this prolonged bullish pattern, although buying pressure appears to have softened recently.
Capital Inflows and Market Sentiment
Despite some signs of lingering bullish momentum, AAVE’s Capital Market Flow (CMF) has shown fluctuations, most recently sitting at +0.06—a notable decline from +0.23 on May 25. This trend highlights an overall reduction in capital inflows, signaling that investors may be cautious in their strategies. The Relative Strength Index (RSI) also has important implications for market sentiment; currently, it remains above the neutral 50 mark but has shown signs of a possible downward crossover, warning of potential trend reversals.
Short-Term Price Range Patterns
On the 4-hour chart, AAVE’s price has firmly established a range between the $240 and $280 marks, with the midpoint at $260. Recent price action has shown a drop below this mid-range level, raising alarms about potential bearish momentum. The steady buying pressure indicated by the A/D and CMF remains significant, yet the RSI has dropped to 49.3, hinting that bearish sentiment could be gaining traction. Traders should exercise caution in navigating this critical range, as price movements could shift swiftly.
Conclusion and Considerations for Traders
In conclusion, AAVE’s market behavior is exhibiting fluctuating signals, necessitating careful monitoring by traders and investors. Though the altcoin has shown resilience in its bullish trend since early May, recent developments indicate a slowdown in buying pressure and potential bearish momentum. A drop below the $260 mark may serve as a pivotal warning, suggesting a deeper retracement may lie ahead. Therefore, staying alert to market indicators and price trends will be essential for navigating the complexities of this evolving landscape.
As the crypto landscape continues to shift, adhering to sound trading principles and remaining updated with market news will be crucial for anyone involved with AAVE or other cryptocurrencies. While the prospect of bullish rallies exists, vigilance is key to avoiding potential pitfalls in a volatile market.


